Introduction
In this third installment of posts related to the configuration of ADF diagnostics logging we will focus on the following topics: 1) how logs could be added programmatically to the diagnostics log, 2) how new Loggers could be added and configured to the diagnostics logging configuration and 3) how to dynamically configure the WebLogic diagnostics logging. This includes changing the logging levels for the configured loggers at run-time without the need to restart the server.
Main Theme
For some background information regarding diagnostics logging as it relates to ADF, JDeveloper and WebLogic refer to these earlier posts: FAQ #6 - How to fine tune ADF diagnostics logging in JDeveloper 11g R1 , FAQ #7 - How to configure ADF diagnostics logging in standalone WLS using JDeveloper 11g R1 and FAQ #8 - How to perform log analysis using the Diagnostic Log Analyzer in JDeveloper 11g . The main advantages of using Oracle Diagnostics Logging (ODL) when compared to other logging frameworks is its tight integration with WebLogic and JDeveloper. In WebLogic, the logs produced conform to and integrate with the diagnostics logging facility. Diagnostic logs include in addition to the message logged additional information such as the session and user that produced the log entry at run-time. This is essential when analyzing the logs. In JDeveloper the log configuration and analysis is integrated via the Oracle Diagnostics Logging Configuration and Oracle Diagnostics Log Analyzer respectively. Both are discussed in detail in the above referenced posts.
Programmatic Usage
Diagnostic logs can be generated programmatically from within your code by using the ADFLogger class. You simply instantiate an ADFLogger via the static createADFLogger() method and use its log() method. log() accepts a java.util.logging.Level parameter indicating the log level of the message that you are logging and it can be any of the ADFLogger.INTERNAL_ERROR, ADFLogger.ERROR, ADFLogger.WARNING, ADFLogger.NOTIFICATION and ADFLogger.TRACE. You can also use the severe(), warning(), info(), config(), fine(), finer() and finest() methods to do your logging. Here is an example:
// create the ADFLogger
private ADFLogger logger = ADFLogger.createADFLogger("package.class");
// log a trace
logger.log(ADFLogger.TRACE, "A trace log");
Configuration of Custom Loggers in JDeveloper
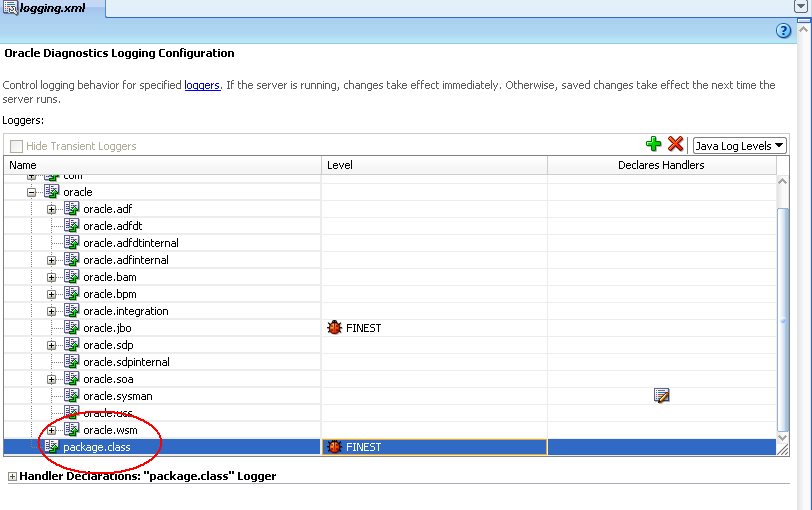
In the ADFLogger example above, "package.class" is a custom logger which is associated with the ADFLogger. You will need to configure this custom logger in the diagnostics logging configuration file logging.xml. Ensure that you load the appropriate logging.xml file for the WebLogic server you are configuring. The file can be found in the domain config\fmwconfig\servers directory for each server. So, open the appropriate logging.xml configuration file in JDeveloper and create a custom logger called "package.class" by clicking on the Add Logger icon as it shown below.
 In the Add Persistent Logger dialog that is presented add the logger class specified above in the ADFLogger (i.e. package.class), set its logging level and click OK.

The custom logger will appear in the list of Loggers as it shown below. With its logging level set appropriately, your trace log in the earlier example will show in the diagnostics log.

Dynamic Configuration of Logging in WebLogic
Diagnostics logging can be configured dynamically in WebLogic via the wlst tool. Ensure that you run the wlst script located in the oracle common directory - %MIDDLEWARE_HOME%\oracle_common\common\bin for a JDeveloper installation - and not the one under the WebLogic server home - %MIDDLEWARE_HOME%\wlserver_10.3\common\bin for the stand-alone WebLogic installed along with JDeveloper. The former provides custom commands for configuring diagnostics logging. First you will need to connect to the admin server via the connect() command as in connect('weblogic','weblogic1','t3://address:7001'). To change the logging level for the custom logger class above, use the setLogLevel() command as in setLogLevel(target="ManagedServer1", logger="package.class", level="ERROR"). Specify the target WebLogic server with the target= argument (ManagedServer1 in this example), the logger class with the logger= argument and the new logging level with the level= argument. It can be either a Java level or an ODL level. Some valid Java levels are: SEVERE, WARNING, INFO, CONFIG, FINE, FINER, or FINEST. Valid ODL levels include a message type followed by a colon and a message level. The valid ODL message types are: INCIDENT_ERROR, ERROR, WARNING, NOTIFICATION, TRACE, and UNKNOWN. The message level is represented by an integer value that qualifies the message type. Possible values are from 1 (highest severity) through 32 (lowest severity). Additional commands for dynamic configuration of the diagnostics log will allow you to configure the Log Handler for each logger class, display the currently configured loggers and so on. For more details, check out the documentation references sited below.
Conclusion
If you are considering a logging framework for an application to be deployed on WebLogic, I suggest that you take a closer look at the Oracle Diagnostics Logging facility. Its tight integration with JDeveloper (logging configuration and log analysis) and WebLogic (diagnostics log format, dynamic configuration) makes it a comparable choice.
Until the next time, keep on JDeveloping!
References
Logging Custom WLST Commands
Using Custom WLST Commands
In this third installment of posts related to the configuration of ADF diagnostics logging we will focus on the following topics: 1) how logs could be added programmatically to the diagnostics log, 2) how new Loggers could be added and configured to the diagnostics logging configuration and 3) how to dynamically configure the WebLogic diagnostics logging. This includes changing the logging levels for the configured loggers at run-time without the need to restart the server.
Main Theme
For some background information regarding diagnostics logging as it relates to ADF, JDeveloper and WebLogic refer to these earlier posts: FAQ #6 - How to fine tune ADF diagnostics logging in JDeveloper 11g R1 , FAQ #7 - How to configure ADF diagnostics logging in standalone WLS using JDeveloper 11g R1 and FAQ #8 - How to perform log analysis using the Diagnostic Log Analyzer in JDeveloper 11g . The main advantages of using Oracle Diagnostics Logging (ODL) when compared to other logging frameworks is its tight integration with WebLogic and JDeveloper. In WebLogic, the logs produced conform to and integrate with the diagnostics logging facility. Diagnostic logs include in addition to the message logged additional information such as the session and user that produced the log entry at run-time. This is essential when analyzing the logs. In JDeveloper the log configuration and analysis is integrated via the Oracle Diagnostics Logging Configuration and Oracle Diagnostics Log Analyzer respectively. Both are discussed in detail in the above referenced posts.
Programmatic Usage
Diagnostic logs can be generated programmatically from within your code by using the ADFLogger class. You simply instantiate an ADFLogger via the static createADFLogger() method and use its log() method. log() accepts a java.util.logging.Level parameter indicating the log level of the message that you are logging and it can be any of the ADFLogger.INTERNAL_ERROR, ADFLogger.ERROR, ADFLogger.WARNING, ADFLogger.NOTIFICATION and ADFLogger.TRACE. You can also use the severe(), warning(), info(), config(), fine(), finer() and finest() methods to do your logging. Here is an example:
// create the ADFLogger
private ADFLogger logger = ADFLogger.createADFLogger("package.class");
// log a trace
logger.log(ADFLogger.TRACE, "A trace log");
Configuration of Custom Loggers in JDeveloper
In the ADFLogger example above, "package.class" is a custom logger which is associated with the ADFLogger. You will need to configure this custom logger in the diagnostics logging configuration file logging.xml. Ensure that you load the appropriate logging.xml file for the WebLogic server you are configuring. The file can be found in the domain config\fmwconfig\servers directory for each server. So, open the appropriate logging.xml configuration file in JDeveloper and create a custom logger called "package.class" by clicking on the Add Logger icon as it shown below.


The custom logger will appear in the list of Loggers as it shown below. With its logging level set appropriately, your trace log in the earlier example will show in the diagnostics log.
Dynamic Configuration of Logging in WebLogic
Diagnostics logging can be configured dynamically in WebLogic via the wlst tool. Ensure that you run the wlst script located in the oracle common directory - %MIDDLEWARE_HOME%\oracle_common\common\bin for a JDeveloper installation - and not the one under the WebLogic server home - %MIDDLEWARE_HOME%\wlserver_10.3\common\bin for the stand-alone WebLogic installed along with JDeveloper. The former provides custom commands for configuring diagnostics logging. First you will need to connect to the admin server via the connect() command as in connect('weblogic','weblogic1','t3://address:7001'). To change the logging level for the custom logger class above, use the setLogLevel() command as in setLogLevel(target="ManagedServer1", logger="package.class", level="ERROR"). Specify the target WebLogic server with the target= argument (ManagedServer1 in this example), the logger class with the logger= argument and the new logging level with the level= argument. It can be either a Java level or an ODL level. Some valid Java levels are: SEVERE, WARNING, INFO, CONFIG, FINE, FINER, or FINEST. Valid ODL levels include a message type followed by a colon and a message level. The valid ODL message types are: INCIDENT_ERROR, ERROR, WARNING, NOTIFICATION, TRACE, and UNKNOWN. The message level is represented by an integer value that qualifies the message type. Possible values are from 1 (highest severity) through 32 (lowest severity). Additional commands for dynamic configuration of the diagnostics log will allow you to configure the Log Handler for each logger class, display the currently configured loggers and so on. For more details, check out the documentation references sited below.
Conclusion
If you are considering a logging framework for an application to be deployed on WebLogic, I suggest that you take a closer look at the Oracle Diagnostics Logging facility. Its tight integration with JDeveloper (logging configuration and log analysis) and WebLogic (diagnostics log format, dynamic configuration) makes it a comparable choice.
Until the next time, keep on JDeveloping!
References
Logging Custom WLST Commands
Using Custom WLST Commands
 |  |


